
🔬 SIR Epidemic Model Calculator
📐 Mathematical Formula
📊 SIR Model Results
📖 Understanding Your Results
Table of Contents
✍️ Author & Academic Authority: Dr. Nitish Kr. Bharadwaj
📘 Qualifications: B.Sc., B.Ed., M.Sc., Ph.D. (Biochemistry), MBA (Financial Management)
🦠 SIR Epidemic Model Calculator
📊 Simulate Disease Spread Instantly
The SIR Epidemic Model Calculator is a powerful computational tool used in epidemiology, microbiology, and immunology to simulate how infectious diseases spread within a population. This model divides a population into three essential compartments: Susceptible (S) 🧍, Infected (I) 🤒, and Recovered (R) 💪. By applying mathematical equations, this calculator enables users to predict disease progression, estimate infection peaks, and evaluate intervention strategies.
Have you ever wondered 🤔 how scientists predicted the spread of COVID-19, influenza, or measles across millions of people — sometimes weeks before the peak hit? The answer lies in one of the most powerful and elegantly simple tools in all of mathematical biology: the SIR Epidemic Model. Our SIR Epidemic Model Calculator brings this cutting-edge epidemiological framework directly to your fingertips 🖥️, empowering students 🎓, researchers 🔬, educators 📚, and public health enthusiasts 🌍 to simulate, visualize, and understand epidemic dynamics without needing a PhD in mathematics.
🔬 What is the SIR Epidemic Model?
The SIR Model is a cornerstone of mathematical epidemiology and microbiology, originally formulated by Kermack and McKendrick in 1927 📅. It classifies every individual in a population into one of three compartments at any given point in time:
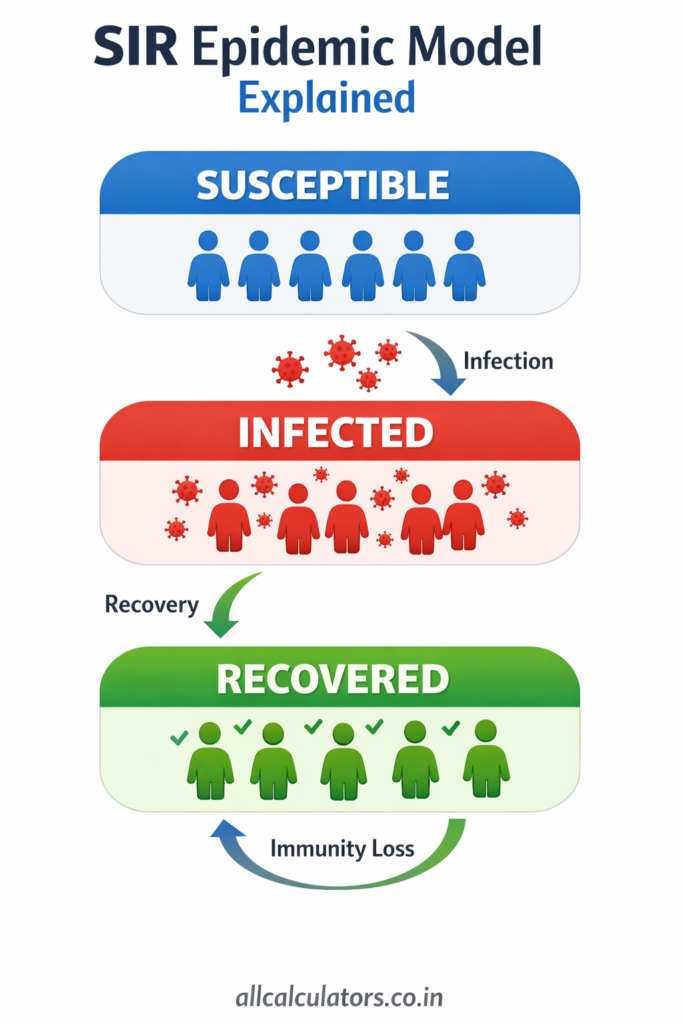
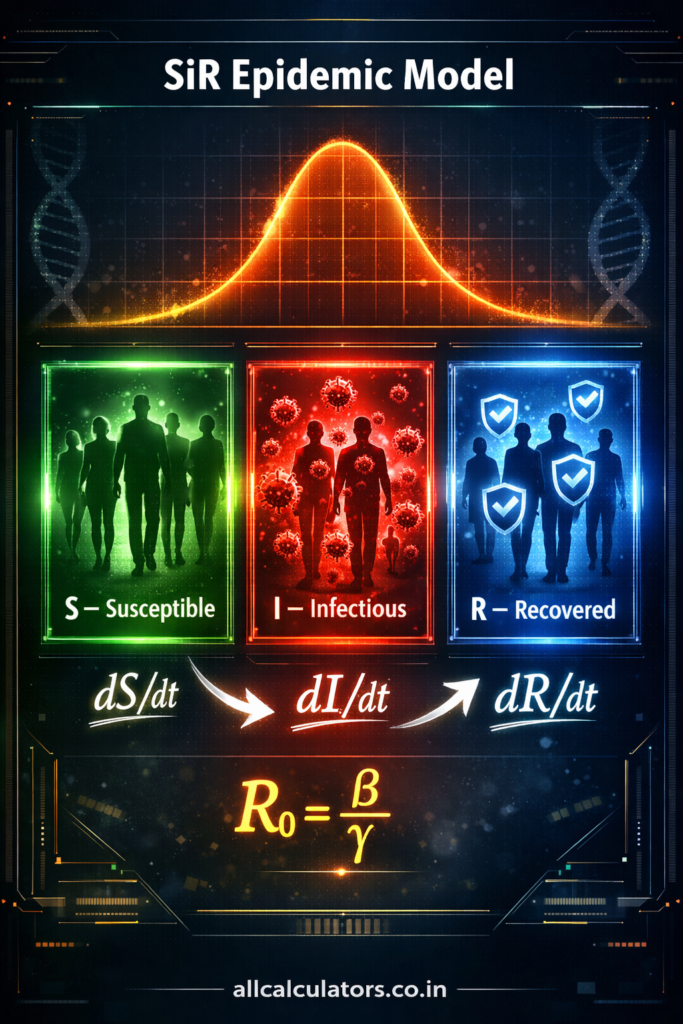
🟢 S — Susceptible: Individuals who have not yet been infected but are at risk. They are vulnerable to contracting the disease upon contact with an infectious person.
🔴 I — Infectious (Infected): Individuals currently carrying and transmitting the pathogen. They actively spread the disease to susceptible members of the population.
🔵 R — Recovered / Removed: Individuals who have either recovered (gaining immunity 🛡️), died ☠️, or been quarantined 🏥 — effectively removed from the transmission chain.
The SIR model assumes a closed population (no births or deaths changing the total), meaning at every moment: S + I + R = N (total population). The elegant simplicity of this three-compartment system allows it to model a remarkable range of real-world infectious diseases including measles, mumps, rubella, influenza, smallpox, and even COVID-19 🦠.
⚙️ Key Parameters: β, γ, and the Mighty R₀
The SIR Epidemic Model is governed by two critical biological rate parameters that drive all epidemic simulations:
📌 Beta (β) — Transmission Rate: This is the rate at which the disease spreads from an infectious individual to a susceptible one. It reflects how contagious the pathogen is and depends on factors like contact frequency, pathogen virulence, and population density 👥.
📌 Gamma (γ) — Recovery Rate: This is the rate at which infectious individuals recover (or are removed). It is mathematically the inverse of the average infectious period — meaning if someone stays infectious for 10 days, γ = 0.1 per day ⏱️.
🌟 R₀ — The Basic Reproduction Number: Perhaps the most talked-about metric in all of epidemiology, R₀ (pronounced “R-naught”) represents the average number of secondary infections one infected individual causes in a completely susceptible population. It is calculated as R₀ = β / γ.
- If R₀ < 1 📉: Each infected person infects fewer than one other — the epidemic fades away naturally.
- If R₀ = 1 ➡️: The disease persists at a constant endemic level.
- If R₀ > 1 📈: The disease spreads exponentially — a full-blown epidemic 🚨 is underway!
For context: measles has an R₀ of 12–18 😱, seasonal flu around 1.2–1.4, while COVID-19 variants ranged from 2.5 to over 8 depending on the variant and population immunity.
📊 The SIR Differential Equations Explained
The SIR model is mathematically expressed through a system of ordinary differential equations (ODEs):
- dS/dt = −βSI/N → Susceptible population decreases as infections occur
- dI/dt = βSI/N − γI → Infectious population grows with new infections but shrinks as recoveries happen
- dR/dt = γI → Recovered population grows as infectious individuals heal
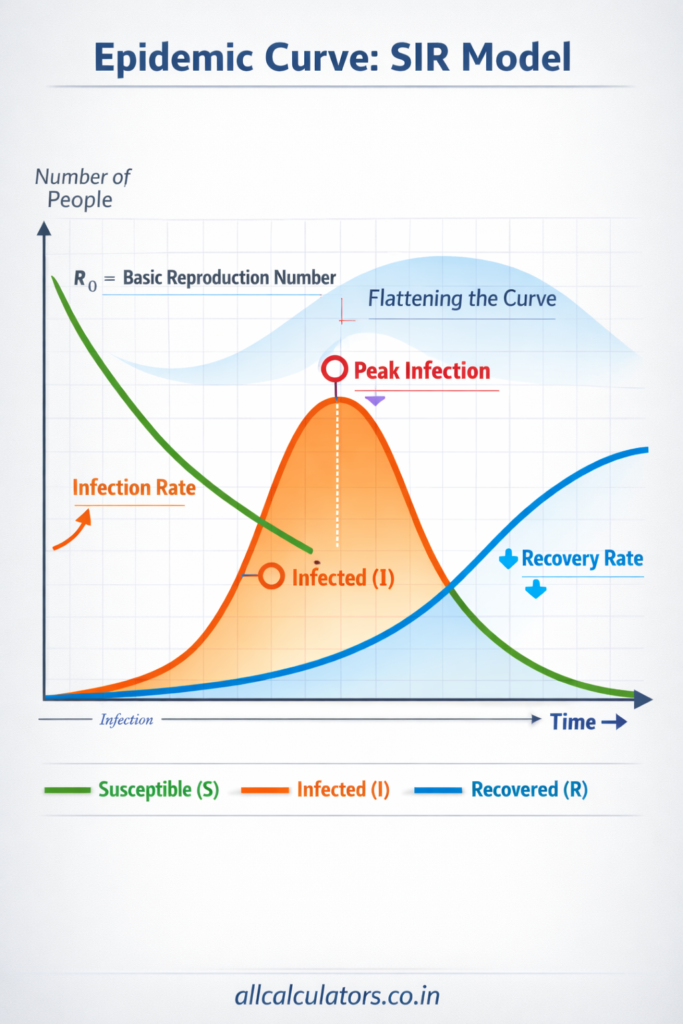
These equations capture the epidemic curve 📈 — that characteristic bell-shaped rise and fall of infection cases that public health officials monitor so closely during outbreaks.
🛡️ Herd Immunity & Vaccination Strategy
One of the most critical applications of the SIR calculator is estimating the Herd Immunity Threshold (HIT) — the percentage of a population that must be immune (through infection or vaccination 💉) to prevent epidemic spread. The formula is:
HIT = 1 − (1/R₀) × 100%
For measles with R₀ = 15, herd immunity requires ~93% of the population to be immune. For flu (R₀ = 1.3), just ~23% immunity can halt spread! 💡 This is exactly why vaccination coverage percentages differ so drastically between diseases.
🎓 Why Use Our SIR Epidemic Model Calculator?
Our free online SIR Model Calculator lets you input your own values for:
- 👥 Total Population (N)
- 🔴 Initial Infected (I₀)
- ⚙️ Transmission Rate (β)
- 💊 Recovery Rate (γ)
…and instantly computes the R₀ value, peak infection count, epidemic duration, herd immunity threshold, and plots the full S-I-R trajectory curve over time 📉📈. Whether you’re a NEET biology aspirant 📖, a BSc/MSc microbiology student 🔬, a public health researcher 🏛️, or simply a curious mind wanting to understand how pandemics unfold 🌐 — this calculator is your ultimate educational companion.
The SIR model has been used by the WHO, CDC, ICMR, and countless research institutions worldwide 🌎 to inform vaccination policies, lockdown decisions, healthcare resource planning, and outbreak containment strategies. Understanding it is no longer optional for anyone studying biology, medicine, or data science — it is essential knowledge for the 21st century 🚀.

🌍 Applications in Human Life
🦠 Pandemic Preparedness: Governments and health ministries use SIR model outputs to plan hospital capacity 🏥, ventilator stockpiles, and ICU beds before epidemic peaks arrive.
💉 Vaccination Campaign Planning: Public health agencies calculate the exact percentage of a population needing vaccination to achieve herd immunity 🛡️ — directly derived from R₀ calculations in the SIR model.
📊 School & Office Outbreak Management: When flu season hits 🤧, school administrators and HR departments use epidemic curve projections to decide on closures, sanitization drives, and attendance policies.
📱 COVID-19 Contact Tracing Apps: The algorithms behind Aarogya Setu and similar contact-tracing apps 📲 are fundamentally based on SIR-type compartmental modeling.
🌾 Agricultural Disease Spread: Farmers and agricultural scientists apply SIR logic to model crop disease epidemics 🌿 — protecting food supply chains from devastating pathogen outbreaks.
📰 Misinformation & Viral Spread Modeling: Researchers even use extended SIR models to study how fake news 📣 and rumors spread through social networks — treating information like a “contagion.”
🎮 Gaming & Simulation Education: SIR-based simulations appear in biology teaching software, UPSC/NEET prep platforms 📚, and even popular strategy games modeling civilization-level disease events.
🧪 Drug & Vaccine Trial Design: Pharmaceutical researchers use SIR modeling to estimate how effective a candidate vaccine needs to be to reduce R₀ below 1 and halt epidemic spread in clinical trial planning 🔬.
⚠️ Disclaimer
⚠️ Disclaimer: The SIR Epidemic Model Calculator on AllCalculators.co.in is designed exclusively for educational, academic, and informational purposes 📚🎓. The results generated are based on simplified mathematical models and idealized assumptions — they do not account for real-world complexities such as age-structured immunity, population heterogeneity, varying contact rates, vaccine waning, or emerging pathogen mutations 🦠. Do NOT use these results as a substitute for professional medical advice, clinical epidemiological assessments, or public health policy decisions 🏥🚫. For any disease-related concerns, always consult a qualified medical professional or certified public health authority 👨⚕️👩⚕️. Real epidemic forecasting requires validated data, expert modeling teams, and institutional oversight. Use this tool to learn, explore, and understand — not to diagnose or prescribe! 💡✅

📌 Related Calculator
❓ FAQs
❓ What is the SIR epidemic model?
🦠 The SIR model is a mathematical framework used in epidemiology to simulate how infectious diseases spread by dividing populations into susceptible, infected, and recovered groups.
❓ How does the SIR model calculator work?
📊 It uses infection rate (β) and recovery rate (γ) to calculate disease progression and estimate key metrics like R₀ and outbreak duration.
❓ What is R0 in the SIR model?
🔢 R₀ (basic reproduction number) indicates how many people one infected person can infect. It helps determine whether an outbreak will grow or decline.
❓ Can this calculator predict real pandemics?
🌍 It provides theoretical predictions and simulations, but real-world outcomes depend on many unpredictable variables.
❓ Who can use this SIR calculator?
🎓 Students, researchers, healthcare professionals, and anyone interested in disease spread modeling can use this tool effectively.