
🦠 Bacterial Growth Curve Calculator
Table of Contents
✍️ Author & Academic Authority: Dr. Nitish Kr. Bharadwaj
📘 Qualifications: B.Sc., B.Ed., M.Sc., Ph.D. (Biochemistry), MBA (Financial Management)
🧫 Bacterial Growth Curve Calculator
Understand Microbial Population Dynamics Instantly!
Have you ever wondered how a single bacterium can multiply into millions within just a few hours? 🤔 The answer lies in one of the most fascinating concepts in microbiology and ecology — the bacterial growth curve. Whether you are a biology student trying to ace your exams, a microbiology researcher working in a laboratory, a food scientist predicting spoilage timelines, or simply someone curious about how invisible microorganisms shape our world, this free online Bacterial Growth Curve Calculator on AllCalculators.co.in is built precisely for you! 🎯

🔬 What is a Bacterial Growth Curve?
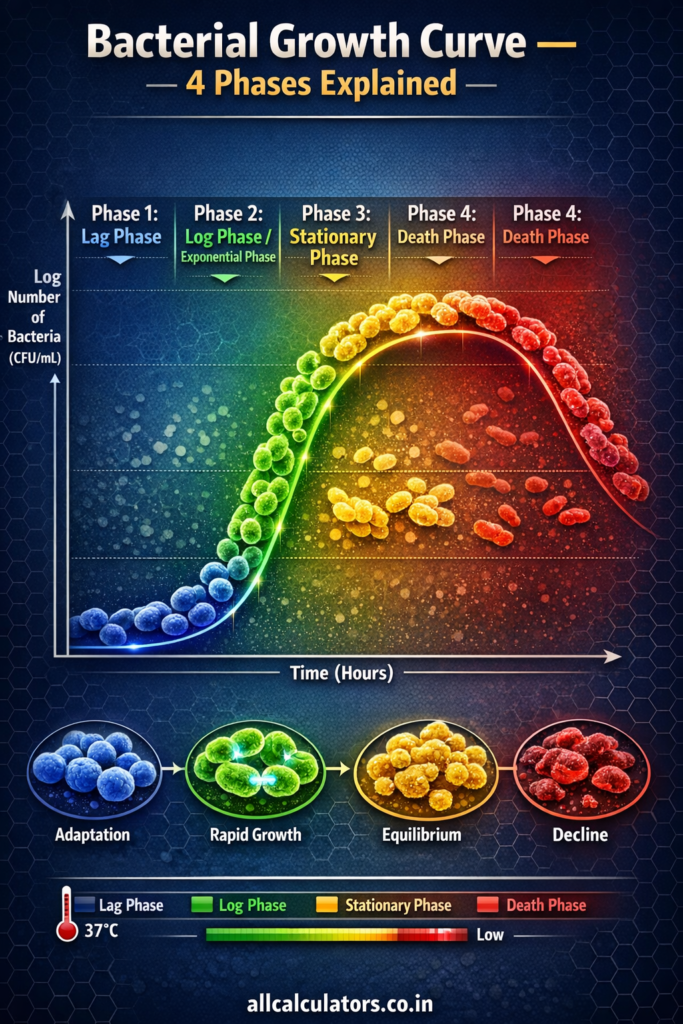
A bacterial growth curve is a graphical and mathematical representation of how a bacterial population changes in size over time when introduced into a fresh growth medium under controlled conditions. It is one of the most fundamental tools in microbiology, environmental biology, and population ecology. The curve classically takes the shape of a sigmoidal (S-shaped) curve when nutrients are limited, or a J-shaped curve during unrestricted exponential growth. By plotting the logarithm of the number of viable bacterial cells (measured as Colony Forming Units per milliliter, or CFU/mL) against time, scientists and students can visually identify four distinct and critical phases of bacterial life.
📊 The Four Phases of the Bacterial Growth Curve — Explained!
🔵 1. Lag Phase — This is the initial, adaptive stage of bacterial life in a new environment. During the lag phase, bacteria are metabolically very active but are NOT dividing rapidly. Instead, they are busy synthesizing essential enzymes 🧪, repairing cellular damage, producing RNA and proteins, and adjusting to the temperature, pH, and nutritional composition of the medium. The duration of the lag phase depends heavily on the bacterial species, the inoculum size (how many bacteria were introduced), the previous growth history of the culture, and the composition of the medium. A stressed or nutrient-deprived bacterial culture will typically exhibit a much longer lag phase than a healthy, log-phase culture transferred to a similar medium.
🟢 2. Log Phase (Exponential Phase) — This is arguably the most critical and mathematically rich phase of the bacterial growth curve! 🚀 During the log phase (also called the exponential phase), bacteria grow and divide at a constant, maximum rate by the process of binary fission — one bacterium splits into two, two into four, four into eight, and so on in a geometric progression. The population size doubles with every generation time (also called doubling time). For example, the common laboratory bacterium Escherichia coli can divide every 20 minutes under optimal conditions, meaning one cell can theoretically produce over 16 million cells in just 8 hours! 😲 The growth during this phase follows the mathematical formula: N = N₀ × 2ⁿ, where N is the final population, N₀ is the initial population, and n is the number of generations. The specific growth rate (μ) and generation time (g) are the two most important parameters calculated from this phase. This is the phase where antibiotics 💊 are most effective, since most antibiotics target actively dividing cells.
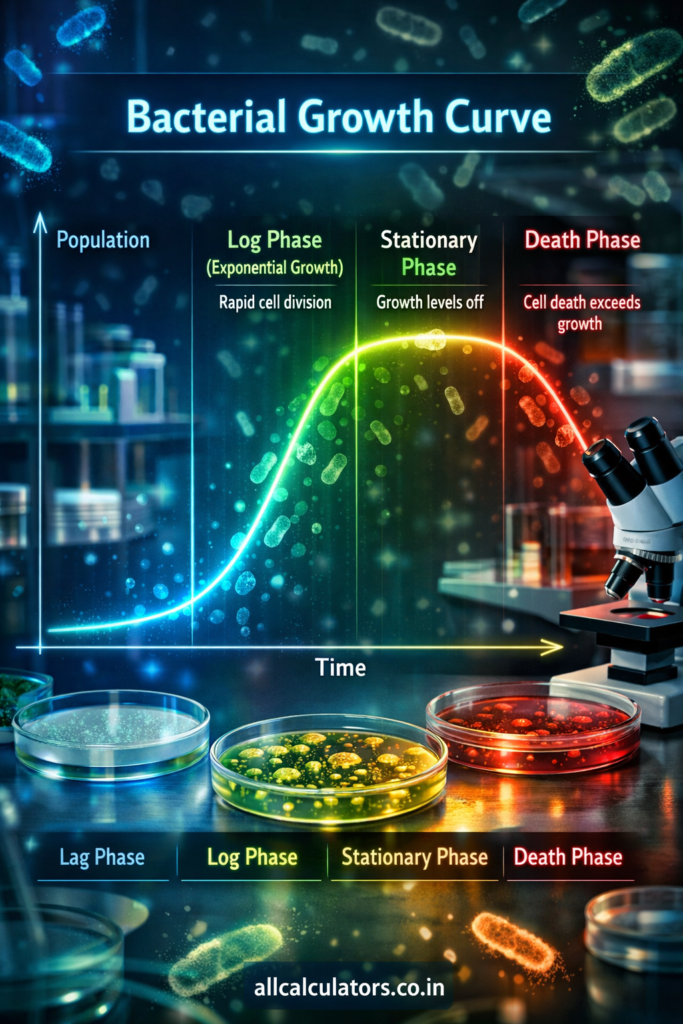
🟡 3. Stationary Phase — As nutrients become depleted and toxic metabolic waste products accumulate in the culture medium, the rate of bacterial cell division begins to equal the rate of cell death. The result is a plateau in the growth curve — this is the stationary phase. The total viable cell count remains roughly constant, but the population is no longer growing net-positively. Many bacteria produce secondary metabolites, including antibiotics, pigments, toxins, and spores, during this phase as survival strategies. Industrial microbiologists and pharmaceutical researchers often focus on this phase to harvest these valuable compounds. 💡
🔴 4. Death Phase (Decline Phase) — When nutrient exhaustion becomes extreme and toxic waste builds up beyond survivable limits, the number of dying cells permanently exceeds the number of dividing cells. The population begins to decline logarithmically. Some bacterial cells may enter a state of dormancy or form endospores (in spore-forming species like Bacillus) to survive harsh conditions for extended periods. Understanding the death phase is crucial in food preservation, sterilization, and antibiotic therapy. 🦠
🧮 Key Calculations Performed by This Calculator
Our Bacterial Growth Curve Calculator helps you accurately compute:
✔️ Generation Time (g) — The time required for the bacterial population to double, calculated as: g = t / n, where t is elapsed time and n is the number of generations.
✔️ Number of Generations (n) — Computed using: n = (log N − log N₀) / log 2, or equivalently n = 3.322 × (log N − log N₀).
✔️ Specific Growth Rate (μ) — Defined as: μ = ln(N/N₀) / t, expressed in reciprocal hours (h⁻¹) or reciprocal minutes.
✔️ Final Population Size (N) — Using the exponential growth model: N = N₀ × 2^(t/g).
✔️ Growth Rate Constant (k) — Calculated as: k = n / t (generations per hour).
🌡️ Factors That Influence the Bacterial Growth Curve
Many environmental and biological factors shape the growth curve:
🌡️ Temperature — Each bacterial species has an optimal growth temperature. Mesophiles (like E. coli) thrive at 37°C, while thermophiles (like those in hot springs) prefer 50–80°C. Refrigeration slows bacterial growth by extending the lag phase.
🧂 Nutrient Availability — Carbon, nitrogen, phosphorus, and trace elements directly determine the maximum population size (carrying capacity, K) and the speed of exponential growth.
⚗️ pH Levels — Most pathogenic bacteria prefer near-neutral pH (6.5–7.5). Acidic conditions (as in yogurt or pickled foods) inhibit growth significantly.
💧 Water Activity (aW) — Bacteria require sufficient water to grow. Drying or using high salt/sugar concentrations reduces water activity and halts bacterial growth.
🌬️ Oxygen Levels — Aerobic bacteria need oxygen; anaerobes are killed by it; facultative anaerobes can thrive in both conditions.
📐 Why Use an Online Bacterial Growth Curve Calculator?
Manual calculations of generation time, growth rate constants, and population projections are time-consuming and prone to arithmetic errors, especially during exams or lab reports. Our free online microbial growth rate calculator eliminates this frustration by providing instant, accurate results with step-by-step solutions. Whether you need to determine the doubling time of bacteria for a homework problem, calculate exponential phase growth parameters for a research report, or simply verify your manual calculations — this tool is your perfect academic and professional companion! 🎓
Used widely by students of Class 11, Class 12, BSc Microbiology, MSc Biology, MBBS, and PhD researchers, this calculator aligns with NCERT, CBSE, ICSE, and international curriculum standards, ensuring it is relevant for learners across India and globally. 🌍

🌍 Applications in Daily Life
Even though bacteria are microscopic, their growth impacts our daily lives significantly:
🍔 Food Industry Safety: Bacterial growth determines food spoilage. Using a bacterial growth calculator, food scientists predict shelf life and prevent contamination.
💊 Medicine & Healthcare: Doctors and researchers use bacterial growth models to understand infections and antibiotic effectiveness 🏥.
🚰 Water Treatment: Bacteria are used to break down waste in sewage systems. Growth calculations help maintain optimal conditions.
🌱 Agriculture: Soil bacteria enhance crop productivity. Farmers indirectly benefit from understanding microbial population dynamics.
🧪 Biotechnology: Industrial fermentation processes (like yogurt, cheese, antibiotics) rely heavily on bacterial growth phases.
⚠️ Disclaimer 📢
This Bacterial Growth Curve Calculator is designed for educational and informational purposes only 📘. While it provides highly accurate results based on standard microbiological formulas, it should not be used as a substitute for professional laboratory analysis or scientific research validation 🧪. Always verify results with experimental data when conducting critical research or medical studies. Use responsibly for learning, practice, and general problem-solving.
📌 Related Calculator
❓FAQs Section
❓ What is a bacterial growth curve?
The bacterial growth curve is a graphical representation showing how bacterial population changes over time through four phases: lag, log, stationary, and death phase.
❓ How do you calculate bacterial growth rate?
The growth rate is calculated using the formula r = (ln N – ln N₀) / t, where N is final population and N₀ is initial population.
❓ What is doubling time in bacteria?
Doubling time is the time required for a bacterial population to double in size, calculated using g = ln(2)/r.
❓ Why is the log phase important?
The log phase represents exponential growth where bacteria divide rapidly, making it crucial for scientific calculations and experiments.
❓ Where is bacterial growth calculation used?
It is widely used in microbiology, food safety, environmental science, medicine, and biotechnology industries.