
🌿 Shannon Diversity Index Calculator
| # | Species Name / Label | No. of Individuals (nᵢ) | ✕ |
|---|
| Species | nᵢ | pᵢ = nᵢ/N | ln(pᵢ) | −pᵢ × ln(pᵢ) |
|---|
Table of Contents
✍️ Author & Academic Authority: Dr. Nitish Kr. Bharadwaj
📘 Qualifications: B.Sc., B.Ed., M.Sc., Ph.D. (Biochemistry), MBA (Financial Management)
🌱 Shannon Diversity Index Calculator
Measure Biodiversity, Species Richness & Ecosystem Health Instantly!
Biodiversity is the heartbeat of our planet 🌍. Every forest, river, ocean, and meadow hosts a complex web of species that interact, compete, and thrive together. But how do scientists, ecologists, students, and researchers actually measure this biodiversity in a meaningful, mathematical way? The answer lies in one of the most powerful and widely-used tools in ecology and environmental biology — the Shannon Diversity Index (H). And with our free Shannon Diversity Index Calculator, you can compute it in seconds — no complex math, no confusion, just clean, instant results! 🚀
🔬 What is the Shannon Diversity Index?
The Shannon Diversity Index, also widely known as the Shannon-Wiener Diversity Index or Shannon Entropy Index, is a quantitative measure used to assess the diversity of species within a biological community or ecosystem. It was first introduced by the legendary mathematician and engineer Claude Shannon in 1948 as part of his groundbreaking Information Theory — originally designed to measure uncertainty or “entropy” in communication systems. Brilliant ecologists recognized the remarkable parallel between information entropy and species diversity, and the formula was rapidly adopted into ecology, population biology, and environmental science. 🎓
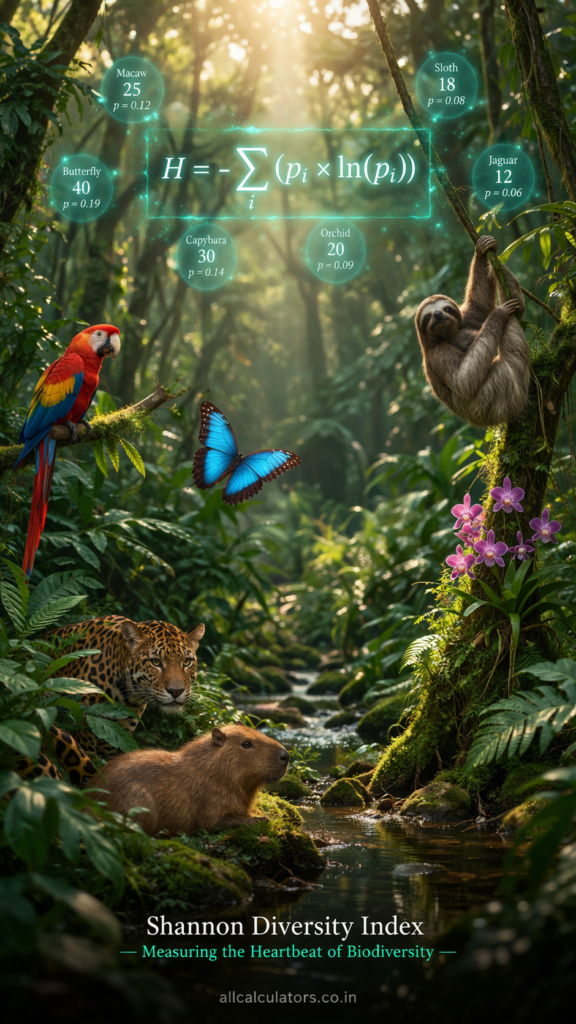
The index is mathematically expressed as: H = −Σ [ pᵢ × ln(pᵢ) ]
Where:
- H = Shannon Diversity Index value
- pᵢ = Proportion of individuals belonging to species i (i.e., number of individuals of species i ÷ total number of all individuals)
- Σ = Summation across all species
- ln = Natural logarithm (base e)
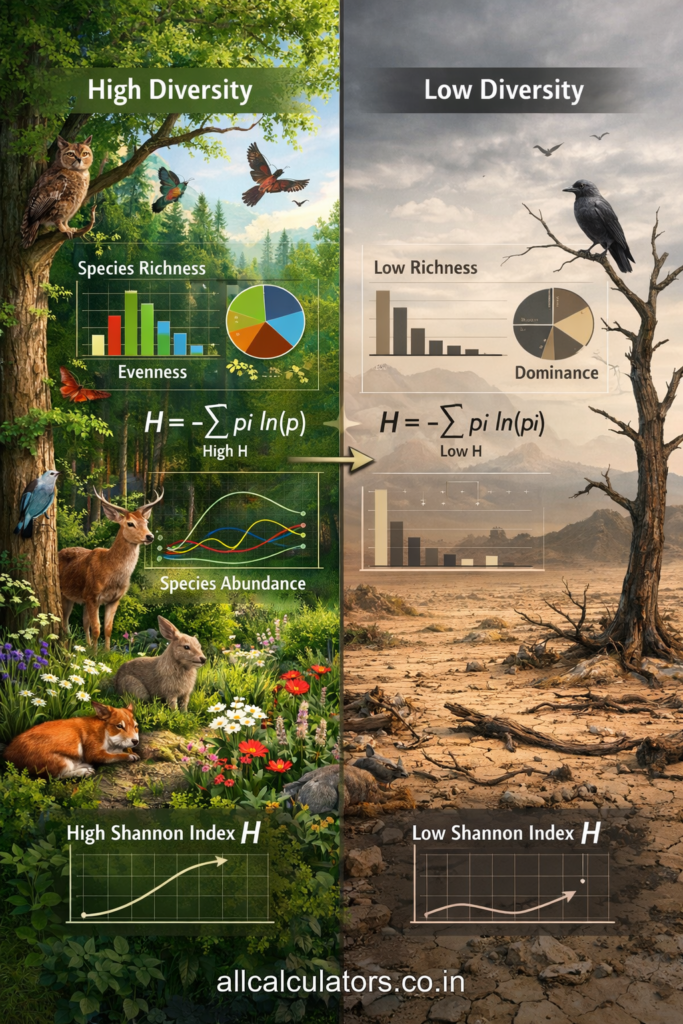
The beauty of this formula is that it simultaneously captures two critical dimensions of biodiversity:
- 🌿 Species Richness — the total number of distinct species present in the community.
- ⚖️ Species Evenness — how equally or unequally the individuals are distributed among those species.
A community where 5 species each have 20 individuals is far more diverse than a community where 5 species exist but one dominates with 96 individuals while the remaining 4 are nearly absent — even though both technically have the same species richness! The Shannon Index elegantly captures this nuance, making it a far superior measure of biodiversity compared to simple species counts. 💡
📊 How to Interpret the Shannon Diversity Index Value (H’)?
Understanding your calculated H value is essential for any ecological or academic study:
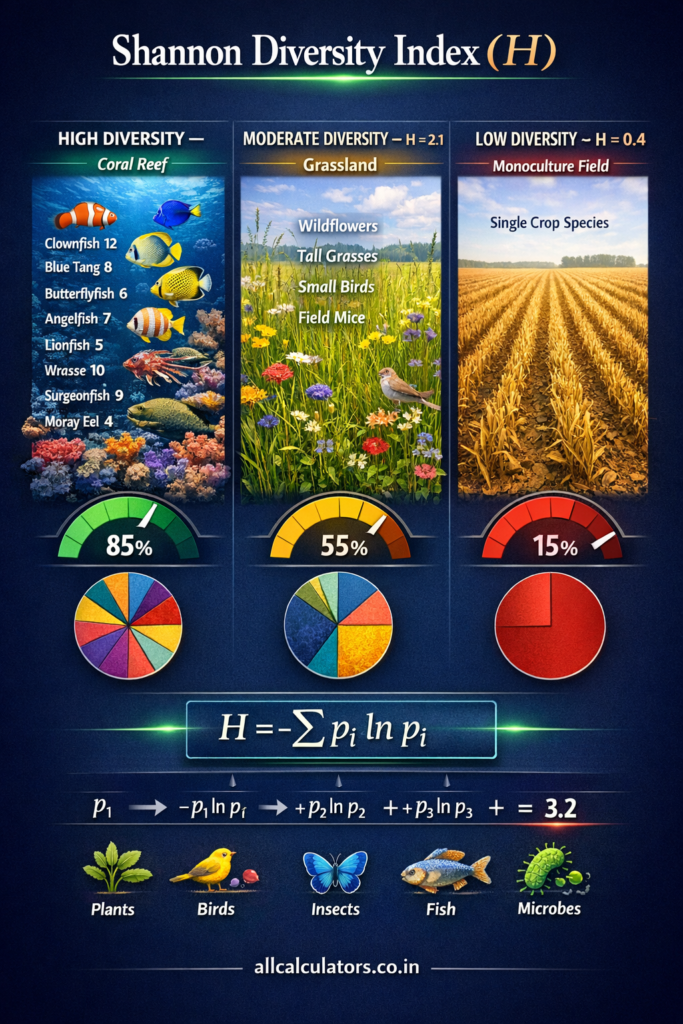
- H = 0 🔴 → Absolute zero diversity. Only ONE species exists in the entire habitat. No variety whatsoever.
- H = 1.0 to 2.0 🟡 → Low to Moderate Diversity. The community has some variety, but one or a few species tend to dominate.
- H = 2.0 to 3.0 🟢 → Good Diversity. A healthy, reasonably balanced community with multiple species represented.
- H > 3.0 🌟 → High Diversity. Found in rich, stable ecosystems like tropical rainforests, coral reefs, and pristine wetlands.
- Real-world range: Most natural ecological communities score between H = 1.5 and H = 3.5 when using natural logarithms.
Additionally, our calculator also provides the Shannon Evenness Index (E), calculated as: E = H / ln(S)
Where S is the total number of species. Evenness ranges from 0 to 1, where a value of 1 indicates perfectly equal abundance across all species — the gold standard of ecological balance. 🌟
🧮 How to Use the Shannon Diversity Index Calculator?
Using our free online Shannon Diversity Index Calculator at allcalculators.co.in is extremely simple:
- 📝 Enter the number of individuals for each species in your sample (you can add multiple species).
- ➕ Add as many species as needed — our tool supports large datasets.
- 🖱️ Click “Calculate” and instantly receive:
- Shannon Diversity Index (H) value
- Shannon Evenness Index (E)
- Total Species Richness (S)
- Total Number of Individuals (N)
- 📖 Interpret your results using the built-in guide.
No software installation, no Excel formulas, no manual calculations — just fast, accurate, browser-based biodiversity computation! ✅
🌍 Why is the Shannon Diversity Index So Important in Ecology & Environmental Science?
The Shannon Diversity Index is not just an academic formula — it is a critical decision-making tool used globally across multiple fields:
🌲 Forest Ecology: Researchers use H values to compare the tree species diversity of old-growth forests vs. plantation forests, guiding sustainable forestry policies and conservation priorities.
🐠 Marine Biology & Coral Reefs: Marine biologists use the Shannon Index to monitor fish and coral species diversity in reef systems — a declining H value can signal bleaching events, pollution, or overfishing before visible damage occurs.
🦋 Conservation Biology: Wildlife conservationists calculate Shannon Index scores to identify which habitats deserve immediate protection, where biodiversity hotspots are located, and whether conservation interventions are actually working.
💧 Water Quality & Freshwater Ecology: Macroinvertebrate diversity in rivers and lakes is routinely assessed using Shannon’s Index — low H values in aquatic systems often indicate pollution, eutrophication, or habitat degradation.
🌡️ Climate Change Research: Long-term monitoring of Shannon Index values helps scientists track how climate change is reshaping ecosystems — shifts in H over decades reveal which species are being lost and at what rate.
🏙️ Urban Ecology: City planners and environmental consultants use the Shannon Index to assess biodiversity in urban green spaces, parks, and nature reserves — helping design more ecologically friendly cities.
🌾 Agriculture & Agroecology: Farmers and agronomists calculate species diversity of beneficial insects, pollinators, and soil microorganisms to evaluate the ecological health of farmland and design regenerative agriculture strategies.
🧬 Microbiology & Gut Health Research: Modern microbiome science applies Shannon’s formula to measure the diversity of microbial communities in the human gut — higher Shannon scores in gut microbiota are consistently associated with better immune function and overall health!
🆚 Shannon Diversity Index vs. Simpson’s Diversity Index — What’s the Difference?
Both are widely used biodiversity metrics, but they differ in emphasis:
| Feature | Shannon Index (H) | Simpson’s Index (D) |
|---|---|---|
| 🔑 Sensitivity | Higher sensitivity to rare species | More sensitive to dominant species |
| 📐 Formula Base | Information entropy (logarithmic) | Probability of dominance |
| 📊 Value Range | 0 to ∞ (typically 1.5–3.5) | 0 to 1 |
| 🎯 Best Used For | Balanced diversity assessments | Measuring dominance patterns |
For comprehensive biodiversity assessments, ecologists often calculate both indices together to get a complete picture. Our calculator at allcalculators.co.in is your all-in-one tool! 🛠️
🏆 Why Use Our Free Shannon Diversity Index Calculator?
✅ 100% Free — No registration, no subscription, no hidden charges. 🚀 Instant Results — Get your H value in milliseconds. 📱 Mobile Friendly — Works seamlessly on phones, tablets, and desktops. 🎓 Student Approved — Perfect for school projects, college lab reports, and university research. 🔬 Research Ready — Trusted by ecology students, environmental scientists, and field researchers. 🌐 Browser-Based — No downloads or software required.
Whether you’re a biology student preparing a lab report, an ecologist conducting field surveys, a researcher studying biodiversity patterns, or simply a curious nature enthusiast who wants to understand the richness of your local ecosystem — our Shannon Diversity Index Calculator is the perfect free tool for you! 🌿✨
🌍 Applications in Daily Life
🌿 Environmental Monitoring: Used to assess biodiversity in forests, rivers, and urban ecosystems using a biodiversity calculator online.
📚 Education & Exams: Students use the Shannon index step by step calculator to solve biology and ecology problems quickly.
🌾 Agriculture & Farming: Helps farmers evaluate crop diversity and soil ecosystem health.
🏙️ Urban Planning: City planners use diversity indices to maintain ecological balance in green spaces.
🐟 Wildlife Conservation: Supports conservationists in tracking species diversity and ecosystem stability.
🧪 Scientific Research: Essential in ecological and microbiological studies using species diversity formula calculator.
⚠️ Disclaimer 📢
⚠️ This Shannon Diversity Index Calculator is designed for educational and informational purposes only. While the tool ensures high computational accuracy, results may vary depending on input data quality and assumptions used in ecological models.
📊 Users are advised to verify results for critical research or scientific publications. This tool does not replace professional ecological analysis or field-based biodiversity assessments.
🌿 Always consult a qualified expert when making environmental or conservation decisions based on calculated data.
📌 Related Calculator
❓ FAQs 🔥
❓ What is the Shannon Diversity Index?
It is a mathematical measure used to calculate biodiversity by considering both species richness and evenness.
❓ How do you calculate the Shannon Index step by step?
You calculate proportions of each species, multiply by log values, sum them, and take the negative result.
❓ What is a good Shannon Diversity Index value?
Values above 3 indicate high biodiversity, while values below 1 indicate low diversity.
❓ Why use a Shannon Diversity Index Calculator online?
It saves time, reduces errors, and provides instant accurate results.
❓ What is the difference between species richness and diversity?
Species richness counts species, while diversity also considers distribution.